Tracking Hubble Proposals
The Hubble Space Telescope (HST) is one of the best tools that we have in astronomy. 540 kilometers above the Earth, Hubble is above the atmosphere and gets diffraction limited observations of a wide range of objects. Each cycle (usually once a year), hundreds of astronomers routinely ask for four to five times the amount of HST time and money as is available. HST was launched and is run by NASA, but the science operations are managed by Space Telescope Science Institute. All the approved programs are listed on the data archive. For this analysis I downloaded all the abstracts and observing time associated with each cycle. Below we see the total number of programs per cycle. Click the buttons below to toggle between total and normalized representation.
The total number spiked in cycle 7 before settling to a fairly consitent value and then increasing slowly over the last few years. The spike in cycle 7 is simply because that cycle was about twice as long as all other cycles (this is due to the failure in the NICMOS instrument).
As for the percentage of proposals of different types, we see that after HST was launched there were far more "GTO" projects. These are Guaranteed Time Observer programs which are given to the scientists who build the cameras and sensors on Hubble. After several years these programs are phased out, but new instruments have been added several time, which show up as small increases in the GTO breakdown.
Although the "Cal" projects (routine calibration proposals that help keep HST running smoothly) have remained mostly consistent over the years, the "misc" projects spike as new instruments are added. These miscellaneous projects are mostly commissioning work for the new instruments.
Finally, we see a growth in archival projects after a few cycles, because data is only available for archival research roughly a year after the initial observations.
I checked the MAST archive for all data related to every project. I then summed the exposure time of every project in all cycles. This gives some sense of how much total telescope time was available during each cycle. This same large spike in observing time associated with cycle 7.
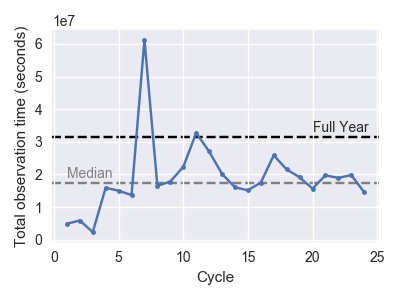
Again, this spike is simply due to the length of Cycle 7 -- GHRS failed in cycle 6 and NICMOS failed in cycle 7 (see here for more) which extended the cycle. Other than that cycle, the exposure time has stayed around the average of 18 million seconds per year (for reference, a year has 31.5 million seconds).
Inequality of Hubble Time
Let's turn now to the number of proposals per person. There are 2484 different PIs listed in the Hubble archive. I counted the number of successful proposals for each PI and found that most people have one, then two and so forth. And note here that we are only counting people who have successful proposals. In reality, the vast majority of proposers likely have no successfull proposals. Below you can see a histogram of the number of people with different numbers of proposals. Note the large tails.
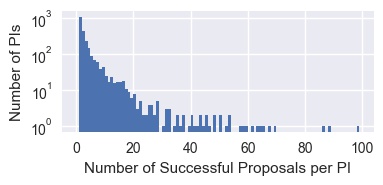
A small percentage of people have the majority of all the successful proposals. This can also be seen if we look at the cumulative distribution.
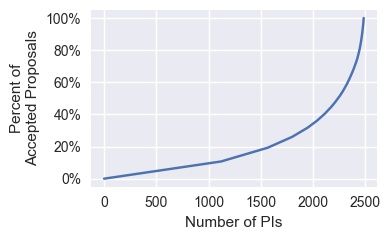 The bottom 2000 PIs have 34% of all proposals, thats the same percentage as the top 111 PIs! One way to quantify this is the Gini coefficient. The Gini coefficient is a popular measure of income inequality and is also used in astronomy to measure how spread out the light is from galaxies. The Gini coefficient for Hubble proposals is 0.6. This is roughly equal to some of the most unequal countries in the world and much larger than the US's income inequality of 0.4.
Who are these top proposers?
If we look at the five PIs with the most total abstracts we see that most of these people have lots of abstracts related to calibrations and are associated with NASA and Space Telescope Science Institute.
If we just focus on the GO proposals we have the most awarded proposers:
Finally, what makes a good proposal? Proposers routinely ask for five times as much Hubble time as is available. With that in mind, there are many small things that proposers need to do to get their proposal accepted. One of these is to have a very novel idea that will help push the field forward. To look for this novelty I wanted to see word use in the abstracts over the cycles. TF-IDF, or term frequency- inverse document frequency, can help us with this. TF-IDF will show you the most common words in a certain document (in this case a document was all GO proposals in a single cycle), but down-weight the words that are very common across all documents (in this case all proposals from all cycles). The result is that the relatively more common words in each cycle will show up, while the very common words across all proposals will not show up.
To be clear here, since we are mixing together all the proposals, a word may have a high term frequency either because it is used heavily in any one proposal or because is was used often across many proposals in that cycle.
In the table below, each row shows the eight words with the highest TF-IDF scores. We can see some interesting trends stand out. The first cycle included the word 'hoped' a lot more than the later cycles - clearly the capabilities of Hubble hadn't been demonstrated yet.
Words like Exoplanet become very common around cycle 20. Many other words are specific instruments (like wfc3) or the date that they are applying in. You can click on the words below to see all corresponding abstracts in the MAST archive.
Another way of looking at this change of word usage is to examine NGrams. We can see some trends below like above, for example exoplanets becomes more common over time. This time I am looking only at the appearance of the word in each abstract. So a word is only counted once for each abstract in a cycle that it appears in.
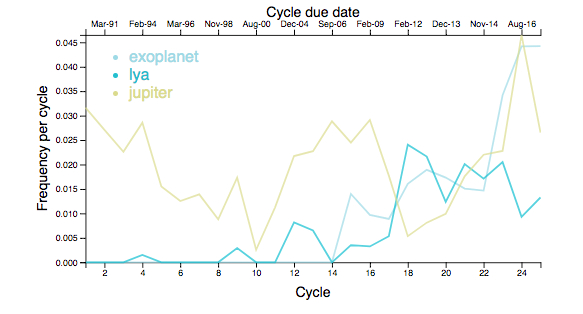 If you want to, you can play around with the data yourself, just like the Google NGram search for books.