The Madison Ultimate Frisbee Association (MUFA) is one of the largest recreational ultimate leagues in the country. They run leagues in the Fall, Spring, and Summer, with the Summer league being the biggest by far. The games proceed in a Swiss style. With each team ranking themselves in the beginning of the year and then playing teams with similar rankings. My experience is that how well you do throughout the year depends a lot on where you rank yourself in the beginning.
I wanted to see if this experience is borne out by the data. I grabbed data about the Summer leagues over the last few years from their registration website.
Self Ratings
Hundreds of teams play throughout the Summer in a Swiss tournament. In the beginning of the summer teams rank themselves from 1 through 10. This number is then used to choose who plays each other throughout the summer. Below we can see the distribution of self ratings for the two summer leagues for 2015 through 2017. In each year there is a Monday and Wednesday league which has only the intermediate and rec teams, along with a Tuesday and Thursday league which also has an advanced league.
The median self-ranking hovers around 4 each year with larger tails at the lower ranking and a remarkably flat distribution over the higher rankings.

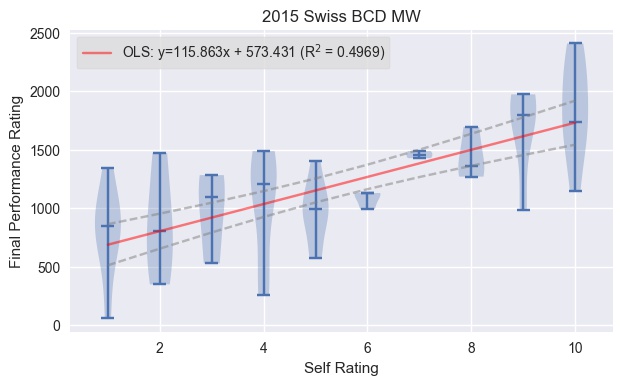
Self Ratings vs. Performance Ratings
The self ratings get turned into a performance rating. This performance rating changes throughout the summer based on wins and loses. We can see a fairly tight correlation between initial self-rating and final performance rating for many years. That said, there appears to be quite a bit of scatter, which is larger in the Monday and Wednesday leagues.

_TR.jpeg)
_MW.jpeg)
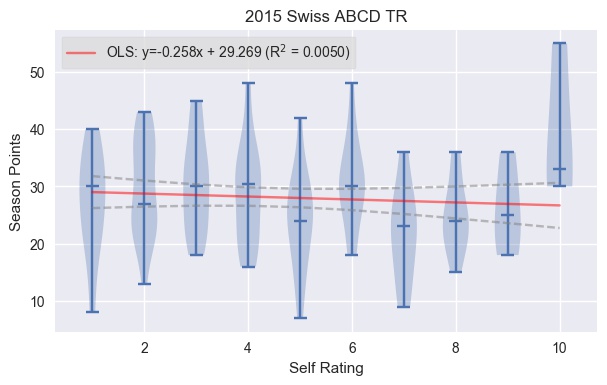
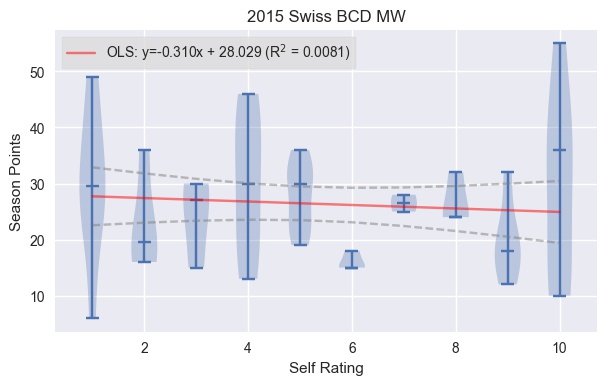
Self Ratings and Points
Now lets look at how points the teams earn as a function of self rating. I computed points by using the formula for soccer: 3 points for a win, 1 point for a tie, and 0 points for a loss. Teams with many more points than average are winning more, and were likely under-ranked in the beginning of the year. It is nice to see that there is no clear trend here. Teams at every self-ranking are winning and losing different numbers of games. To me, this shows that there is not a systematic over or under ranking.
_TR.jpeg)
_MW.jpeg)
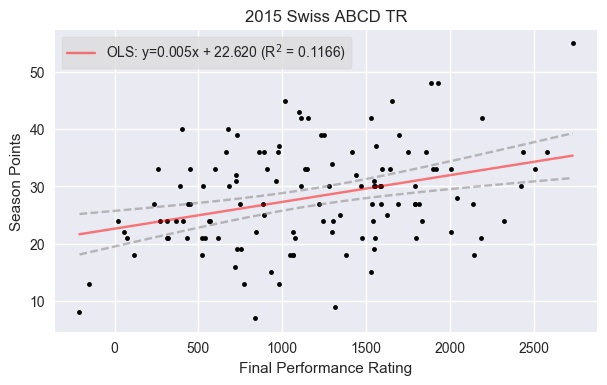
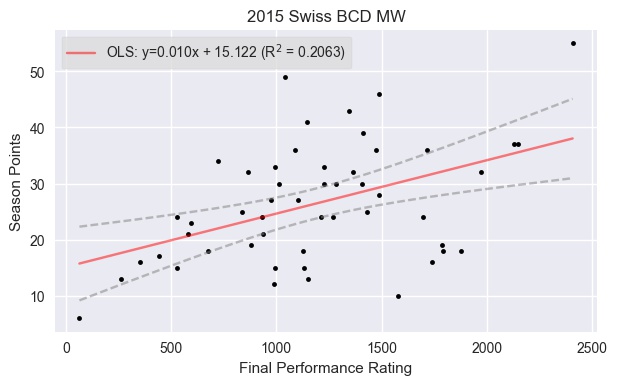
Performance Ratings and Points
Lets look at points again, but this time by performance rating. There is a slightly higher correlation here, and indeed you can see that the teams with the most points typically have the highest performance rating, and the teams with the fewest points have the lowest performance rating. Most of this can be explained by the fact that the performance ratings are being driven by the wins and loses.
_TR.jpeg)
_MW.jpeg)
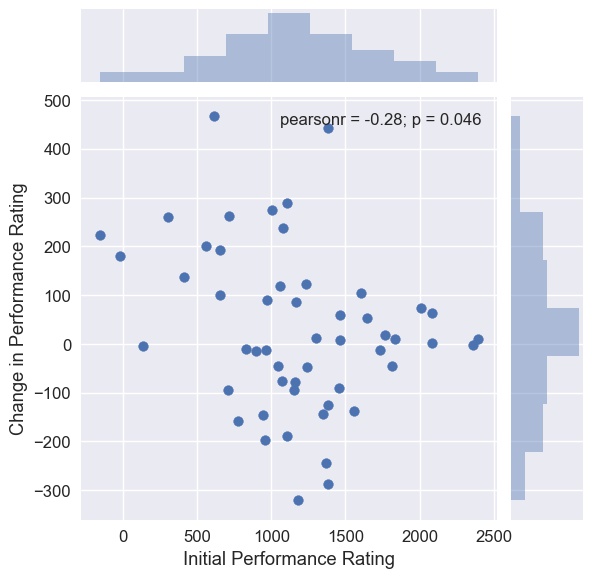
Change in performance rating over one season
How much do most teams change in one season? To test this question, I grabbed data several times during the 2017 Summer season. First let's look at the change in performance rating from the beginning of the year to the end of the year. The mean change looks near zero, and the measured mean is not far off that. The average team gains about 29 rating points in one season. The trend is also mostly flat, with only a very weak (-0.28) negative correlation.
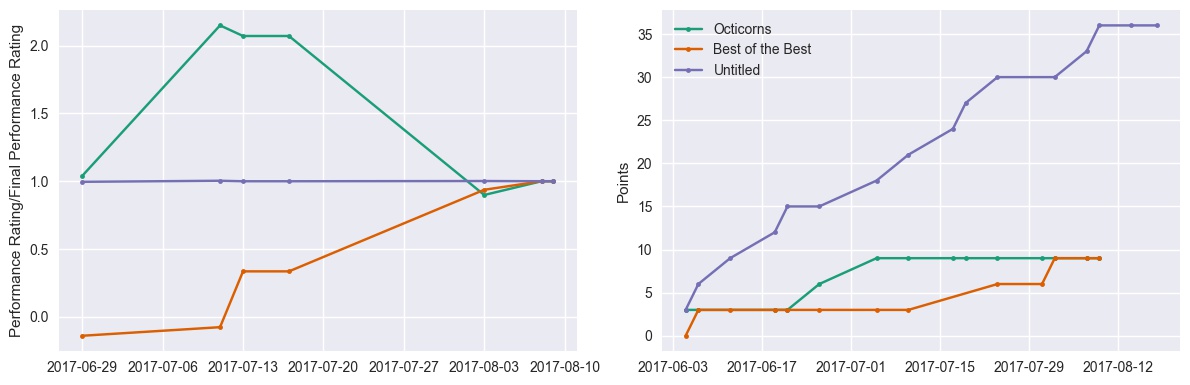
Single teams over one season
I also examined how individual teams change over the course of one year. Below I show the points and performance rating for three teams with very different behaviors. Teams like "Octicorns" started losing their early games, then won many games in a row. This corresponds to the spike in their performance rating in the middle of the season. They leveled off and didn't win another game, causing their performance rating to plummet toward their final value. Teams like "Best of the Best" remained mostly winless until late in the season when they finally found a few wins and increased their performance rating. Teams like "Untitled" won consistently throughout the year, but did so at their expected performance rating, staying mostly flat the entire year.