For most people who only fly a few times a year, the presence of the TSA is a mild anoyance. But many people may have heard horror stories. The TSA claims data was posted on /r/datasets and I decided to take a look.
First up was some mild data cleaning. The datasets have an amount requested column, an amount paid column, and a status column. Some entries were listed as not paid, but had the amount requested as the amount paid out. For the rest of the analysis I used the total amount that the TSA listed as paid, with any entries that were listed rejected set to $0 paid out.
In total, 204263 claims were filed between between 2002 and February 2016 (the most recent data available when I downloaded the dataset) and the TSA paid out more than $16 million USD.
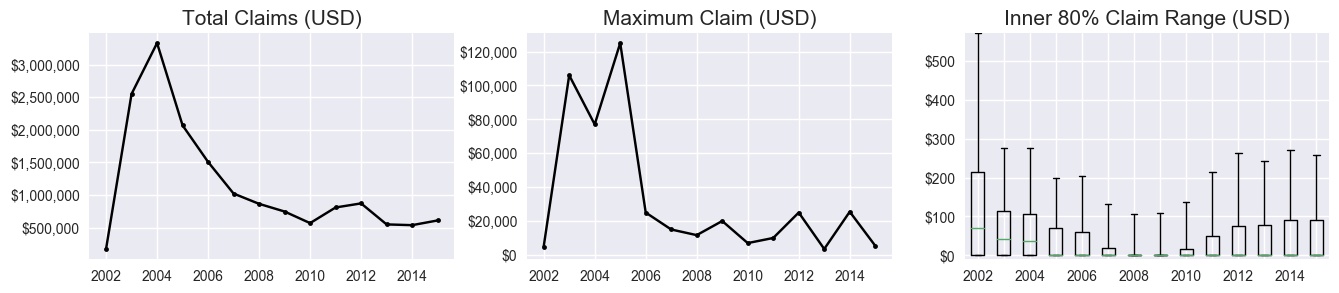
The total amount spiked in 2004 before falling to around $500,000 a year since 2010. The initial years of large total claims is likely driven by a few large personal injury claims. Looking at the inner 80% range on the far right shows a fairly consistent trend. Almost all claims are not paid out, and the 80th percentile sits between $100 and $300 for all years except 2002.
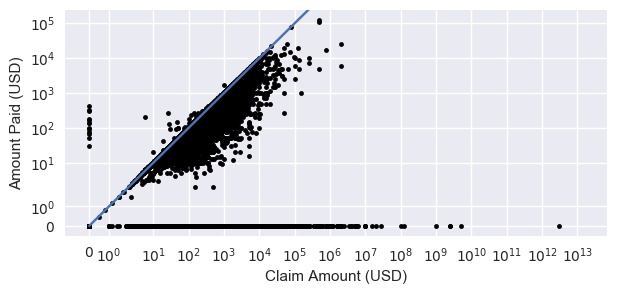
A look at the amount paid out versus amount claimed shows two interesting things (note: this is a symlog plot where all values under $10 are shown in linear scale, and all values over $10 are shown in log-scale, while harder to interpret, this is the only good way I could think of to show off both the enormous range of the data and the large numbers of $0 claims.) First thing is that many people seem to be trolling the TSA by filling enormous claims. The largest claim requested was a nice round $3 trillion. Surprisingly enough, it didn’t get filled.
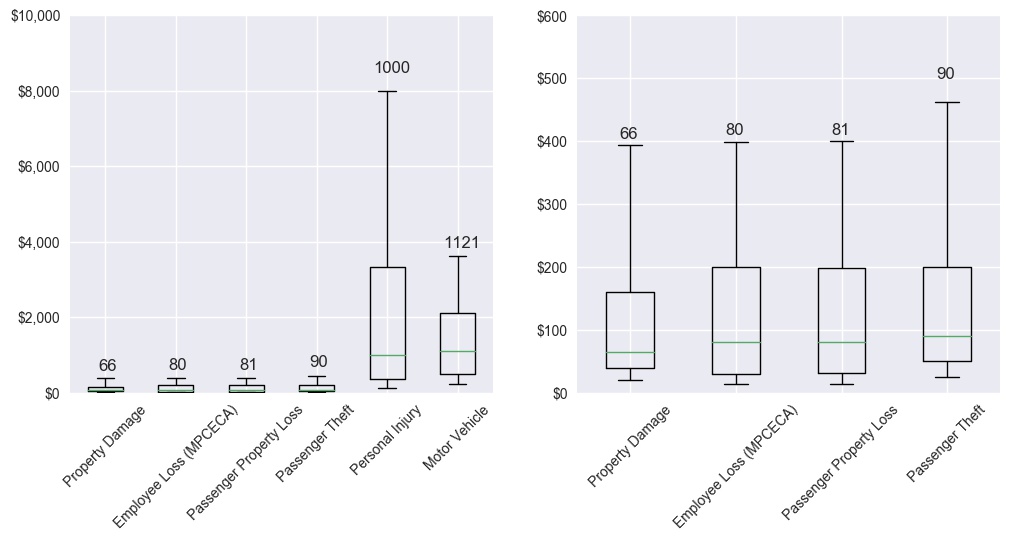
I also broke down the successful claims by type. The largest claims were personal injury, but the highest average claims came from motor vehicle claims. Passenger property loss claims were the lowest. Below you can see boxplots for each type of claim. The green line is the median and the whiskers give the 10th and 90th percentiles.
Finally I took a look at which airports had the most claims. Not suprisingly, bigger airports have more claims. I pulled passenger data for the top 50 airports from aci-na and normalized for claims per passenger. The results are seen in the map below with the top and bottom airports for each year above.