While eating at a restaurant one night, my girlfriend and I wondered whether the restaurants in Madison were rated differently if they served Asian food as opposed to American food. I dug into the ratings of all the Madison area restaurants to check. First, below you can see the distribution of star ratings for each category in the dataset that I used.
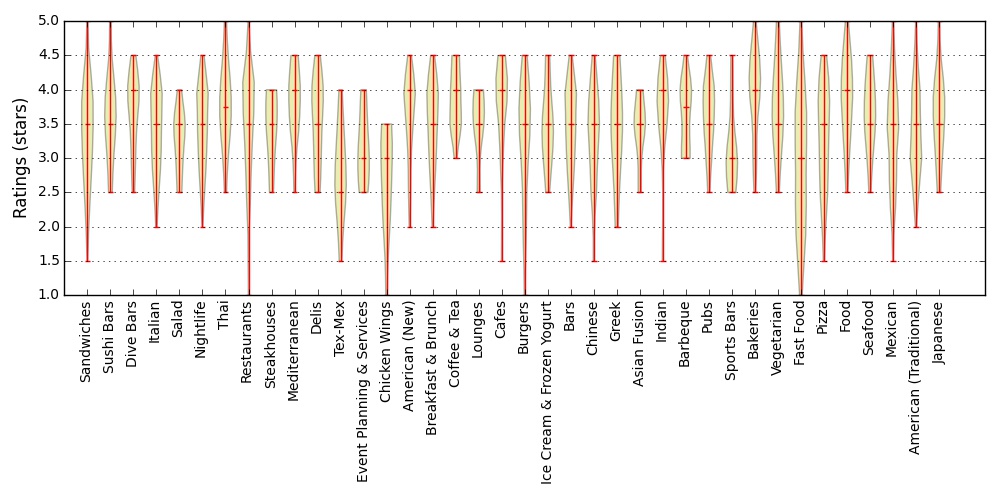
Although they look fairly similar across all categories, a few stood out to me. To check which categories where truly different, I used the two-side Kolmogorov-Smirnov test to determine if the category has a significantly different distribution than all the other restaurants. Because I am doing so many different tests, there is a high likelihood that some will happen to look significant just due to chance. To correct for this, I use the Bonferroni correction. The p-value that I was looking for was 0.00125. Three categories appeared different given this strict p-value requirement: Food Trucks, Fast Food, and Sports Bars.
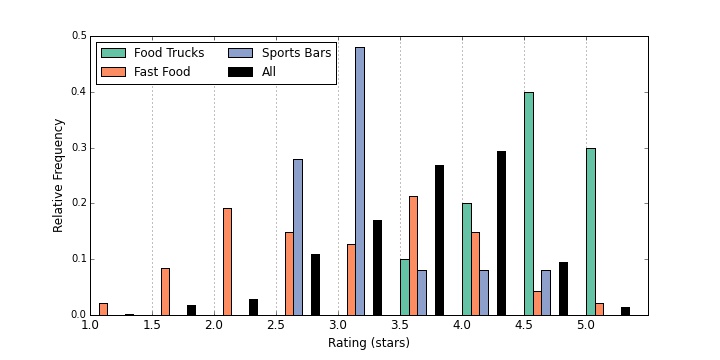
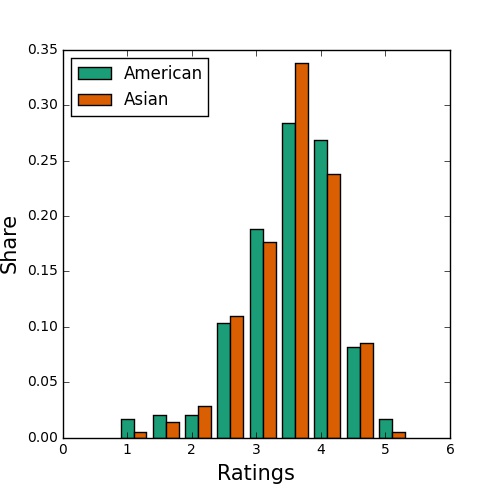
Fast food restaurants have a relatively flat distribution with mostly ower and middle ratings, sports bars are highly peaked around 3 stars, and people in Madison seem to love food trucks. What about Asian food? Restaurants in the category ‘Asian’ have an average rating of 3.4, exactly the same as the average rating of restaurants in the category ‘American.’ You can see the two distributions below, and although they may appear somewhat different, this difference is not significant according to a 2-sample KS test.
One thing I noticed about the dataset was that many restaurants had many different categories. For instance, each ‘Asian’ restaurant was often also in the ‘Japinese’ and ‘Chinese’ and ‘Sushi’ categories. I decided to use clustering to group together similar restaurants and then check if there were differences in ratings between the restaurants. I tried three different approaches.
The first was K-Means clustering with Jaccard Distances, the second was Spectral Clustering using a normalized similarity Matrix between the categories, and the third was Agglomerative Clustering using the overlap in the categories. While Agglomerative Clustering and K-Means clustered on the restaurants directly, Spectral Clustering was used on the categories. Restaurants that had the categories were then assigned to each group.
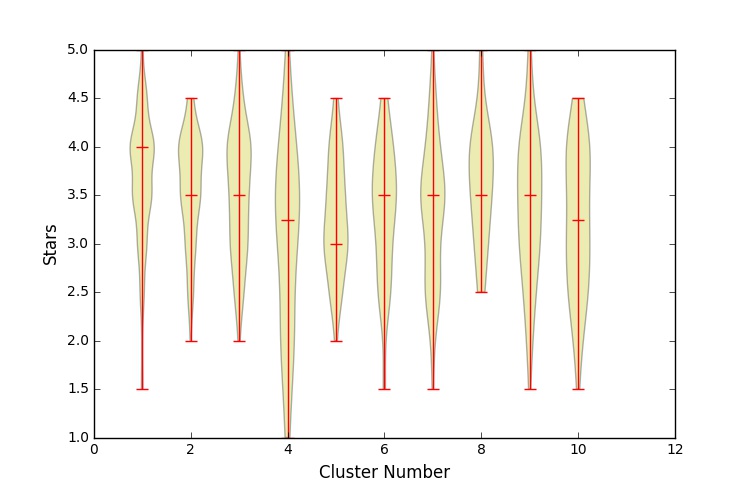
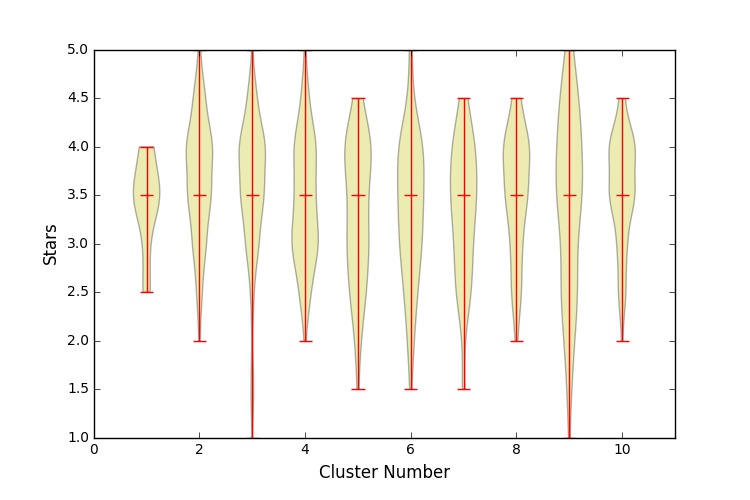
In each case I used 10 clusters. Although the methods differed, the results were broadly consistent: clustering the restaurants into similar groups works (mostly) but shows a fairly low difference between groups. The takeaway from this analysis is that the different types of restaurants are rated broadly consistently across the whole city.
K-Means is a classic algorithm that splits a dataset into K different sections. Usually, the euclidian distance is used to assign points into the closest of the K groups. Instead, I used the Jaccard Distance. The implementation was by github user FindKim. The Jaccard distance is computed by comparing which restaurants belong to the same categories.
No clusters are significantly different from the others.
Spectral Clustering using a similarity matrix. The similarity matrix was made using whether the restaurants belonged to the same categories. I created a NxN matrix where N is the number of different restaurant categories. Each entry (i, j) was set to the total number of co-occurrences of the ith and jth category (the number of times that a restaurant had both categories), divided by the total occurances of the ith category.
No clusters are significantly different from the others.
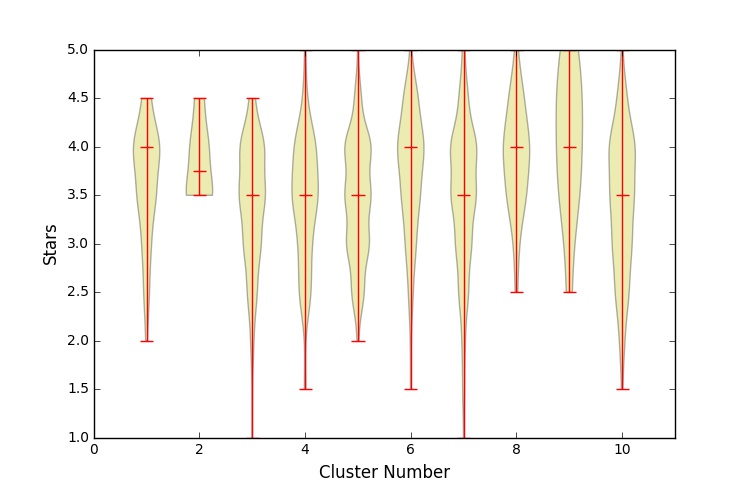
Agglomerative Clustering is a type of heirarchical clustering that recursively merges pairs of clusters that give the smallest increases in a chosen linkage distance. I chose regular euclidian linkage distance, but for a dataset built from the shared tags. I built a NxM binary matrix where N is the number of restaurants and M is the number of unique categories. Each entry to the matrix recorded whether that restaurant fell into that category.
Cluster number 1 is significantly different than the others.