Step Function

10 May 2016

I walk a lot and wear a Fitbit most days. I got interested in seeing trends in my walking and if my iPhone recorded similar measurements. I downloaded the data from Fitbit’s data portal and from my iPhone’s step counter and took a look.

iPhone and Fitbit record similar distances

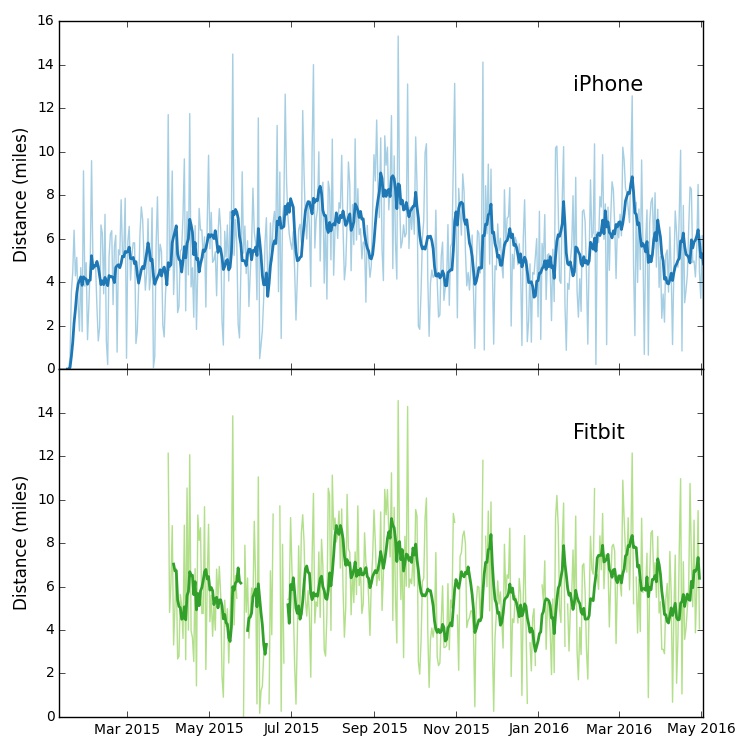
First thing I noticed was how similar the distance measured by each of the iPhone and the Fitbit. Note: In this plot I have removed all days when I wasn’t wearing the Fitbit.

Compare Fitbit and iPhone distances

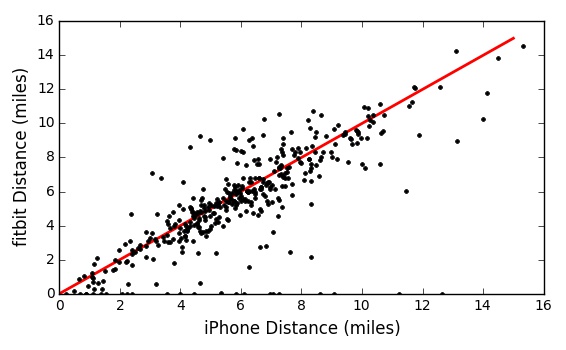
You can see this more clearly if you plot the distance recorded by each device against each other. The red line shows the one-to-one line. In this plot, you can also see a group of Fitbit points at 0 miles. Those are the days that I either ran out of batteries or forgot to wear the Fitbit. This is intersting because the Fitbit has only a step counter, while the iPhone can access the GPS information. It might be interesting to look at the distance per step of each device.

Fitbit and iPhone convert each step to 2.5 feet

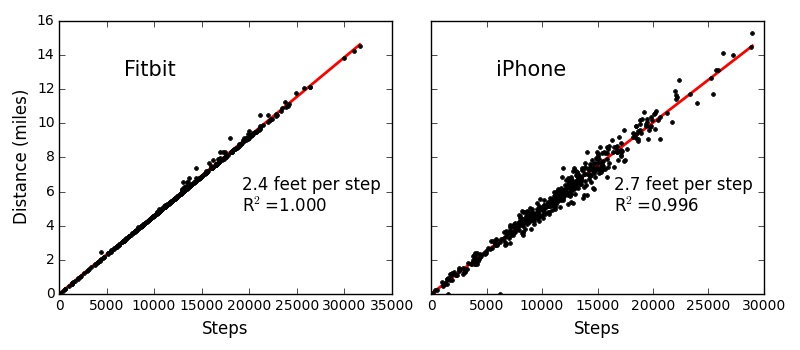
I also found that each device has a very similar relationship between steps and distance (set by my height when I setup the devices). The Fitbit seems to have a floor, with some points rising above this floor (likely when it thinks I am running). The iPhone, on the other hand, has a lot more scatter.

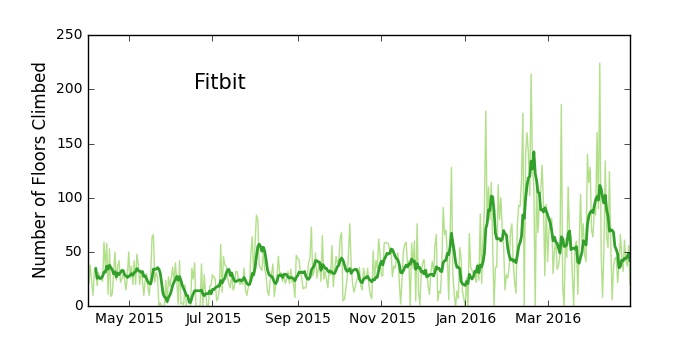
For the Fitbit data, I also download stair and calorie data. The first thing I noticed is that I apparently have climbed a lot more stairs recently.

I've climbed a lot more floors recently

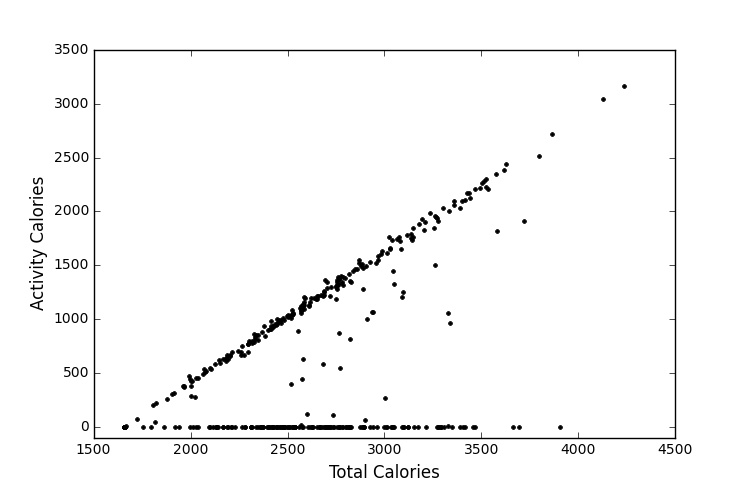
Each day has two measurements of calories, one just from activies, and the other from everything.

Calories

The algorithm that Fitbit uses to figure out calorie burning isn’t public, so I tried to figure it out using a linear regression. I used pandas and statsmodels in Python for the analysis. I first set out to fit the activity calories. I used a simple linear regression to model this, because it captures more than 99% of the variance.

model = sm.OLS(fitbit_data['Activity Calories'], fitbit_data[['Minutes Lightly Active',
                                                              'Minutes Fairly Active',
                                                              'Minutes Very Active']])
results = model.fit()
print results.summary()
                            OLS Regression Results                            
==============================================================================
Dep. Variable:      Activity Calories   R-squared:                       0.998
Model:                            OLS   Adj. R-squared:                  0.998
Method:                 Least Squares   F-statistic:                 6.068e+04
Date:                Tue, 10 May 2016   Prob (F-statistic):               0.00
Time:                        17:11:09   Log-Likelihood:                -2080.3
No. Observations:                 395   AIC:                             4167.
Df Residuals:                     392   BIC:                             4178.
Df Model:                           3                                         
Covariance Type:            nonrobust                                         
==========================================================================================
                             coef    std err          t      P>|t|      [95.0% Conf. Int.]
------------------------------------------------------------------------------------------
Minutes Lightly Active     3.9601      0.039    100.617      0.000         3.883     4.037
Minutes Fairly Active      5.6849      0.287     19.778      0.000         5.120     6.250
Minutes Very Active        8.1145      0.068    119.175      0.000         7.981     8.248
==============================================================================
Omnibus:                      125.840   Durbin-Watson:                   1.597
Prob(Omnibus):                  0.000   Jarque-Bera (JB):              799.825
Skew:                           1.191   Prob(JB):                    2.09e-174
Kurtosis:                       9.552   Cond. No.                         15.4
==============================================================================

Warnings:
[1] Standard Errors assume that the covariance matrix of the errors is correctly specified.

Predicting the total calories is a bit trickier. There is a floor from the basal metabolic rate set by my height, weight, and age. After I subtracted out the minimum value, I was able to fit another simple linear regression. This one explains roughly 98% of the variance in the data.

model = sm.OLS(fitbit_data['Calories Burned']-fitbit_data['Calories Burned'].min(),
               fitbit_data[['Steps','Minutes Lightly Active',
                            'Minutes Fairly Active',
                            'Minutes Very Active']])
results = model.fit()
print results.summary()
                            OLS Regression Results                            
==============================================================================
Dep. Variable:        Calories Burned   R-squared:                       0.983
Model:                            OLS   Adj. R-squared:                  0.983
Method:                 Least Squares   F-statistic:                     5578.
Date:                Fri, 13 May 2016   Prob (F-statistic):               0.00
Time:                        10:28:33   Log-Likelihood:                -2520.0
No. Observations:                 395   AIC:                             5048.
Df Residuals:                     391   BIC:                             5064.
Df Model:                           4                                         
Covariance Type:            nonrobust                                         
==========================================================================================
                             coef    std err          t      P>|t|      [95.0% Conf. Int.]
------------------------------------------------------------------------------------------
Steps                      0.0795      0.001     90.348      0.000         0.078     0.081
Minutes Lightly Active     0.8758      0.123      7.128      0.000         0.634     1.117
Minutes Fairly Active      3.1205      0.876      3.561      0.000         1.398     4.843
Minutes Very Active       -2.1818      0.234     -9.333      0.000        -2.641    -1.722
==============================================================================
Omnibus:                      181.583   Durbin-Watson:                   1.675
Prob(Omnibus):                  0.000   Jarque-Bera (JB):             1209.623
Skew:                           1.838   Prob(JB):                    2.16e-263
Kurtosis:                      10.745   Cond. No.                     1.67e+03
==============================================================================

Warnings:
[1] Standard Errors assume that the covariance matrix of the errors is correctly specified.
[2] The condition number is large, 1.67e+03. This might indicate that there are
strong multicollinearity or other numerical problems.

One interesting thing to notice is that I didn’t use the number of floors climbed in this regression. It seems like Fitbit does not use the floor data for calories. Another thing to note is that almost all of my activities include walking. I don’t know if Fitbit assigns different calories to different activities, and someone who has a variety of activities may not be able to predict their calories with as much certainty.